Comparison of Visual Representations in Junior Secondary School Geography Textbooks on Continental Drift and Plate Tectonics
published: 18 September 2025 | https://doi.org/10.63174/xdi.QWLN3131
Abstract
This research examines 39 visual representations from junior secondary school geography textbooks in China, the US, and the UK, themed “Continental Drift and Plate Tectonics”. This study employs content analysis and the revised Graphical Analysis Protocol (GAP) to evaluate graphics and their integration with text. Two indicators are considered while assessing graphics: Systematicity and Graphic form. The integration of graphics with text is evaluated based on five indicators: Contiguity, Indexical reference, Captions, Semantic relations, and Level of connection. The findings indicate that the geographic schematic map is the primary graphic form utilized in all textbooks. Graphics often exhibit a low degree of systematicity, and most visual representations depict representational semantic relations. PEP and MH demonstrate significant parallels regarding contiguity and indexical reference, with graphics physically associated with related text, and the text includes references to the graphics. Only OUP employs engaging captions.
1. Introduction
Continental Drift and Plate Tectonics are essential contents in junior secondary geography curricula in numerous nations.[1] These notions exhibit considerable abstraction and are temporally relevant. However, in students’ real lives, there often lack corresponding geographical references, thus presenting cognitive hurdles for them.[2]
Textbooks are essential for enhancing students’ comprehension of subjects.[3] Textbooks amalgamate diverse visual representations with textual elucidations to mitigate cognitive strain and improve conceptual understanding. Visual representations provide students with essential perceptual cues, facilitating their comprehension of abstract concepts.[4] By effectively combining text and visual representations, textbooks can give dual coding that aids in students’ comprehension of complex knowledge.[5]
There are obvious distinctions in visual representations in textbooks from different cultural backgrounds when explaining the same theme. Keles noted discrepancies in the graphic depictions of “Life Sciences” among American and Turkish textbooks.[6] Wei Bing discovered notable disparities in the visual depiction of “Optical” across Chinese and Singaporean physics textbooks.[7] The disparities in visual representations might substantially affect students.[6, 7, 9, 20, 21] Therefore, it is essential to perform a comparative analysis of the visual representations of “Continental Drift and Plate Tectonics” in junior secondary school geography textbooks from several different cultural backgrounds.
2. Literature review
Visual representation is a tool for conceptual change, which can make visible phenomena that are too small, too large, too fast, or too slow to be observed with the naked eye, as well as explain intangible or abstract phenomena that cannot be directly observed or experienced.[8] Analyzing the visual representation is essential, as it is a significant component of textbooks. Besides, substantial disciplinary disparities persist in the current analytical instruments. For example, in the domain of science education, Slough et al. established a GAP of eight factors, such as image color, image form, etc., underscoring systematic representation.[9] Gkitzia’s C1 to C5 standards in chemistry education emphasize various representation associations.[10] From a geographical standpoint, Trahorsch formulated four analytical standards, including the type of visual, caption, thematic focus of the visual, and use of color, and these standards emphasize thematic color mapping.[11] This distinct coding scheme emphasizes the necessity of developing an analytical framework that aligns with geographical cognitive attributes, particularly for themes like “Continental Drift and Plate Tectonics” that depend on spatiotemporal reasoning.
The current study demonstrates that various forms of graphics in textbooks exert differing effects on students. For example, charts can enhance students’ retention of explanatory texts and diminish cognitive strain.[12] Maps can depict spatial linkages and improve students’ geographical spatial reasoning.[13] Photographs can describe phenomena that are not directly seen.[14] Comics serve as an efficient instrument for enhancing pupils’ scientific literacy.[15] And when the graphics are presented in the appropriate forms, their integration quality with related text becomes a key variable affecting learning effectiveness. Upahi specifically emphasizes that effective visual representations must incorporate clearly labeled annotations and descriptive captions to explicitly articulate their educational relevance, thereby strengthening the semantic coherence between visual and text.[16] However, in the absence of captions, visuals may be disregarded by pupils, perceived just as ornamental components of the textbook, or misinterpreted.[17,18] Moreover, the spatial proximity of graphics and text can influence attention, as evidenced by Hegarty’s eye-tracking research, which demonstrates that co-locating graphics and text enhances students’ attention switching.[19] The text contains explicit references to the graphics, which are essential for linking the graphics and text. In the absence of references within the text, students may have confusion regarding the placement of pictures and accompanying explanatory information, thereby elevating their cognitive load.[20,21] Furthermore, the color of visual representations might impact students; such as black and white visual representations may diminish the efficacy and motivation of their learning.[22] Research conducted by the aforementioned scholars indicates that various forms of graphics and the integration of graphics with text in textbooks significantly influence pupils. Consequently, it is essential to examine the distribution of graphic forms and the integration of texts and graphics in geography textbooks.
From the perspective of comparative education, the visual representation of textbooks presents cultural cognitive preferences.[23] Countries with diverse cultural backgrounds exhibit variations in the content and techniques of visual representations for the same themes in textbooks. For example, in the context of the theme “Optics” in physics textbooks, Wei Bing observed that the distribution of notational and non-notational representations is uniform in PEP, with a predominance of non-notational representations in SSPE and a prevalence of notational representations in MCE. The predominant graphics and text in SSTP and MCE are closely integrated, whereas a limited number of graphics and text in PEP are situated at a considerable distance.[7] In the content of “Life Science”, Keles discovered that American textbooks contained a greater number of diagrams, but Turkish textbooks featured more photographs. The ratio of brief or problematic captions in Turkish textbooks exceeded that in American textbooks.[6] In addition, regarding the theme of “Chemical Bonds” in chemistry textbooks, Ma Wen found that American textbooks tend to integrate multiple representations. In contrast, Chinese and Singaporean textbooks place more emphasis on caption completeness.[24] The research findings of the aforementioned experts indicate substantial disparities in the visual representations of textbooks from diverse cultural backgrounds while interpreting the same theme. Consequently, it is essential to analyze the visual representations in textbooks from China, the US, and the UK on the theme of “Continental Drift and Plate Tectonics” to identify their similarities and differences.
In conclusion, the research questions to be addressed in this study are listed as follows:
(1) How are graphics presented in the “Continental Drift and Plate Tectonics” section of the four geography textbooks?
(2) How are graphics integrated with text in the “Continental Drift and Plate Tectonics” section of the four geography textbooks?
3. Analysis process
Content analysis (CA) is a research methodology employed to comprehend informational material, encompassing the examination of texts, pictures, symbols, or audio data.[25] This study primarily uses content analysis to encode and categorize the visual representations inside the “Continental Drift and Plate Tectonics” portion of four sets of geography textbooks.
3.1. Study Sample and Units
This study included samples from four sets of junior secondary school geography textbooks from China, the US, and the UK. The disparity in competent units will yield differing levels of review autonomy.[26] Furthermore, owing to the accessibility of textbooks, we have chosen two from China: one published by the People’s Education Press (PEP) in 2024, edited by Fan Jie.[27] This textbook is the most prevalent in China. The other Chinese textbook was published by Sinomap Press (SP) in 2013, edited by Wang Min.[28] The textbook in the US was published by McGraw-Hill (MH) in 2020.[29] The textbook in the UK was published by Oxford University Press (OUP) in 2021, edited by Rosemarie[30]
Due to the differences in knowledge organization among the four textbooks, the content of “Continental Drift and Plate Tectonics” is distributed in different chapters or units in different versions of the textbooks. To ensure the consistency of the research content, for PEP, we choose Grade 7, Volume 1, Chapter 3, Section 2, Section 3; for SP, we choose Grade 8, Volume 1, Chapter 1, Section 2; for MH, we choose Unit 5, Chapter 17, Section 1 and Section 3; for OUP, we choose Chapter 1, Section 5 and Section 2. The basic information on the junior secondary school geography textbooks involved in this study, as well as the selected research sample range, is presented in Table 1. In content analysis, the analysis unit refers to the specific element of the content that is systematically examined and coded.[31] The analysis unit of this study is each isolated graphic and its associated text in the textbook. There are a total of 39 analysis units, including 10 for PEP, 11 for SP, 11 for MH, and 7 for OUP.
Table 1. The Study Sample
| Textbook | Chapter | Section | Page |
|---|---|---|---|
|
PEP (2024) |
Chapter 3. Land and ocean |
Section 3.2 Inspiration obtained from the map. Section 3.3 Plate tectonics |
58-61 61-64 |
|
SP (2013) |
Chapter 1. Earth’s motion and the distribution of land and sea | Section 3.2 Continental drift and plate tectonics. | 20-25 |
|
MH (2020) |
Unit 5. The Dynamic Earth. Chapter 17. Plate Tectonics |
Section 17.1 Drifting Continents Section 17.3 Theory of Plate Tectonics. |
443-447 455-459 |
|
OUP (2021) |
Chapter 1. From rock to soil Chapter 5. Our restless planet |
Section 1.5 The British Isles on their travels. Section 5.2 A cracked Earth? |
14-15 90-91 |
3.2. Coding Scheme
Slough developed the Graphical Analysis Protocol (GAP).[9] Wei Bing revised GAP into two aspects and seven indicators, based on his research on the visual representations of physics textbooks.[7] Regarding the “Graphics form” indicators, graphics in various subject textbooks are categorized differently. For example, Wei Bing classified graphics in physics textbooks into seven categories: Photograph, General graphics, etc.[7] Leivas divides graphics in biology textbooks into five categories: Photographs, Naturalistic Drawings, etc.[32] Guo divides the graphics in elementary school textbooks into nine categories: Comic strips, Diagrams, Flow diagrams, etc.[33] These taxonomic constructs exhibit pronounced discipline-specific signatures characteristic of pedagogical differentiation. Taking into account the situation of geography textbooks, this study replaced the “graphics form” indicator in Wei Bing’s GAP. The “graphics form” of geography textbooks was divided into five categories: Map, Landscape Map, Geographic Schematic Map, Geographic Statistical Graph, and Comic.[34,35] A suitable GAP for analyzing visual representations of geography textbooks was established. The revised GAP is presented in Table 2. To facilitate the understanding of each category in Table 2, a new column has been added to the far right of Table 2, providing examples for each category, as shown in Figure 1.
Table 2. The revised GAP [7,9,34,35]
| Aspects | Indicators | Categories | Meaning | Example |
|---|---|---|---|---|
| Graphics | Graphic form | Map | It is used to express the geographical location, regional scope, and the distribution of geographical things. | Figure1.A |
| Landscape Map | It can reflect the geographical natural scenery or human phenomena more realistically. | Figure1.F | ||
| Geographic Schematic Map | It can describe the characteristics of geographical phenomena and clarify the causes and processes underlying them. | Figure1.B | ||
| Geographic Statistical Graph | It can reflect the quantitative change and quantitative relationship of geographical things. | Figure1.G | ||
| Comic | It uses exaggeration to reflect geographical facts or principles. | Figure1.C | ||
| Systematicity | Low | The graphic depicts an isolated unit. | Figure1.A | |
| Medium | The graphic depicts some aspects of a system, but does not reflect the time sequence. | Figure1.D | ||
| High | The graphic helps viewers build a systematic mental model, reflecting how geographical things change over time. | Figure1.B | ||
| Integration of graphics with text | Contiguity | Distal | The graphic and text appear on different pages, and readers need to turn a page to view them. | Figure1.E |
| Facing | The graphic and text are not displayed on the same page, but on facing pages. | Figure1.C | ||
| Proximal | The graphic and text appear on the same page, but are separated by more than half a page. | Figure1.A | ||
| Direct | The graphic and text are displayed on the same page and are closely adjacent to each other. | Figure1.H | ||
| Indexical reference | No reference | It refers to the lack of supporting text, to promote the integration of graphics with text. | Figure1.D | |
| Text references the graphics | It refers to having supportive text that promotes the integration of graphics with text. | Figure1. A | ||
| Captions | No captions | / | Figure1.D | |
| Identification | The caption is a strong generalization, highly concise language, and has fewer details of graphics. | Figure1.C | ||
| Description | The caption can describe the graphics in detail and connect the graphics with the text. | Figure1.F | ||
| Engagement | The caption actively engages the viewer (e.g., asks a question). | Figure1.H | ||
| Semantic relations | Decorative | It only makes the textbook aesthetically pleasing and has little to do with the text. | / | |
| Representational | It is closely related to the text and can reflect some or all of the text. | Figure1.A | ||
| Organizational | It classifies, organizes, or summarizes the text, increasing the coherence of the text. | Figure1.G | ||
| Interpretational | It can present complex and abstract geographical concepts and principles concisely and vividly, helping students understand. | Figure1.E | ||
| Level of connection | Level 1 | The graphic is easy to interpret, and the new information contained in the graphic is linked to the text. | Figure1.A | |
| Level 2 | The graphic is relatively easy to interpret, and the connection between new information and text is less concrete, requiring the reader to draw inferences to understand the new information. | Figure1.B | ||
| Level3 | The graphic provides new information that requires specific background knowledge and scrutiny to fully comprehend. | Figure1.E |
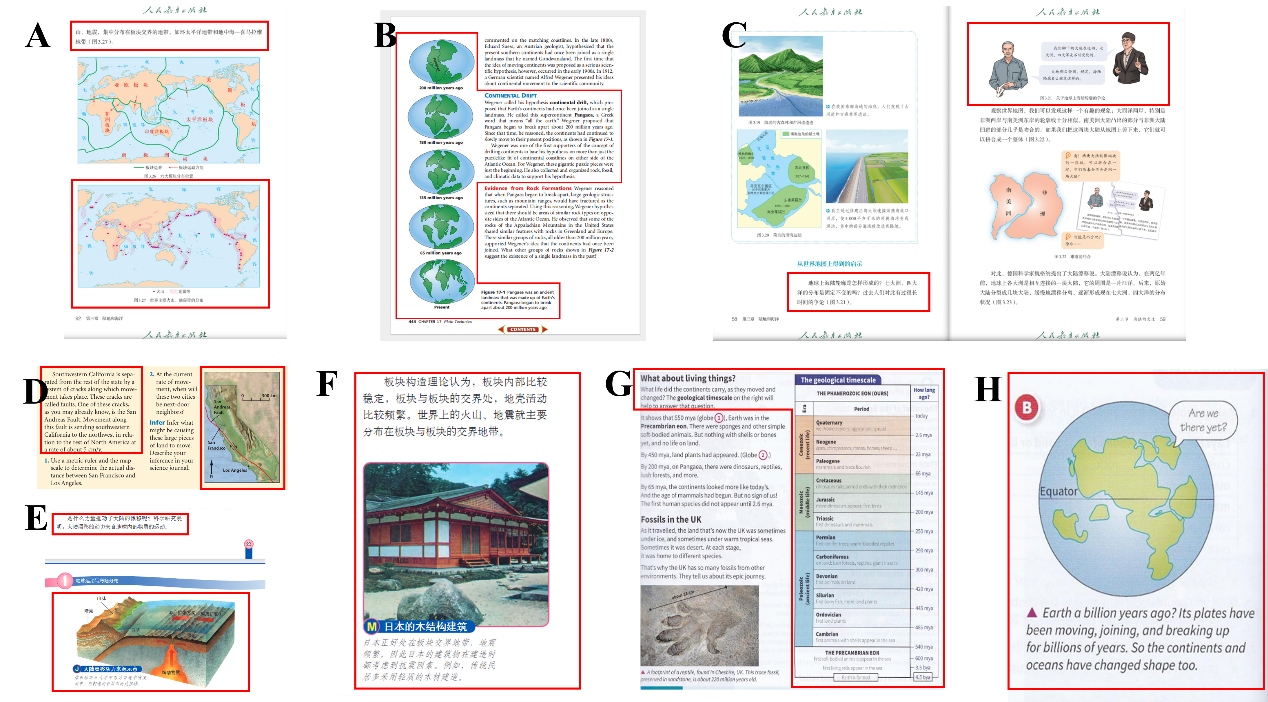
Figure 1. oding Examples. “Figure 1. A” is from page 62 of PEP, “Figure 1. B” is from page 444 of MH, “Figure 1. C” is from pages 58-59 of PEP, “Figure 1. D” is from page 443 of MH, “Figure 1. E” is from page 24 of SP, “Figure 1. F” is from page 25 of SP, “Figure 1. G” is from page 15 of OUP and “Figure 1. H” is from page 90 of OUP.
3.3. Assessing Reliability
To guarantee the trustworthiness of content analysis, two coders with geographical expertise separately encoded 39 visual representations based on the indicators defined in GAP. One coder possesses a doctoral degree in Geography Education: Curriculum and Teaching, along with a decade of research and teaching experience; the other coder is an undergraduate with four years of experience in geography and is preparing to pursue a master’s degree in Geography Education. Using SPSS software, the Kappa values in decibels for Graphic form, Systematicity, Contiguity, Indexical reference, Captions, Semantic elations, and Level of connection were calculated to be 0.956, 0.906, 0.937, 0.930, 0.913, 0.903, and 0.875. The kappa values were all over 0.8, indicating that the encoding is reliable.[36]
The two programmers discussed and reached a consensus after consultation regarding visual representations with inconsistent encoding. For instance, two coders disagreed regarding the encoding of the “Captions” indicator in “Figure 1. H”. The distinction was whether the text beneath “Figure 1. H” was a caption or not. The caption was coded as “Identification” by one coder, who believed that the text was not a caption. Another coder believed that it could be considered a caption, and in this text, the student was posed the question “Earth a billion years ago?”, the caption should be coded as “Engagement”. In light of this divergent perspective, both coders reviewed pertinent literature and discovered that the text was preceded by a triangle symbol. The text was determined to be the caption of the graphics, rather than text. The two programmers deliberated on the encoding of the caption as “Engagement” in conjunction with the GAP standard.
4. Results
4.1. Result 1: To answer the first research question
To answer the first research question, “How are graphics presented in the ‘Continental Drift and Plate Tectonics’ section of the four geography textbooks?”. This study answers from the aspect of graphics, including two indicators (i.e., Graphic form, Systematicity). The analysis results are as follows.
The results of the graphic form analysis are displayed in Table 3. The graphic form having the highest prevalence in the four geography textbooks is the Geographic Schematic Map, with percentages of 50.0%, 63.6%, 63.6%, and 57.1% for PEP, SP, MH, and OUP, all above fifty percent. Four geography textbooks have Maps; however, their percentage is minimal (20.0%, 9.1%, 9.1%, and 14.3% for PEP, SP, MH, and OUP, respectively). The notable characteristic of the two Chinese textbooks is the incorporation of a specific percentage of comics (20.0% for PEP and 9.1% for SP). Among the four textbooks, only OUP (14.3%) employs geographic statistical graphics, while PEP, SP, and MH do not incorporate them.
Table 3. The graphic forms are used in four textbooks.
| Map | Landscape Map | Geographic Schematic Map | Geographic Statistical Graph | Comic | |
|---|---|---|---|---|---|
| PEP | 20.0% | 10.0% | 50.0% | 0.0% | 20.0% |
| SP | 9.1% | 18.2% | 63.6% | 0.0% | 9.1% |
| MH | 9.1% | 27.3% | 63.6% | 0.0% | 0.0% |
| OUP | 14.3% | 14.3% | 57.1% | 14.3% | 0.0% |
The results of the systematicity analysis are displayed in Figure 2. The graphics in the four textbooks predominantly exhibit low systematicity, particularly in SP (72.7%) and PEP (70%). MH (18.2%) exhibits the highest percentage of high systematicity. Notably, all four textbooks have a “Schematic Diagram of Continental Drift”, characterized by high systematicity, effectively illustrating the movement and distribution alterations of tectonic plates across various geological epochs, exhibiting clear dynamism. Furthermore, MH employed “Earth’s Tectonic Plates” to illustrate the velocity of plate movement, which exhibits high systematicity.
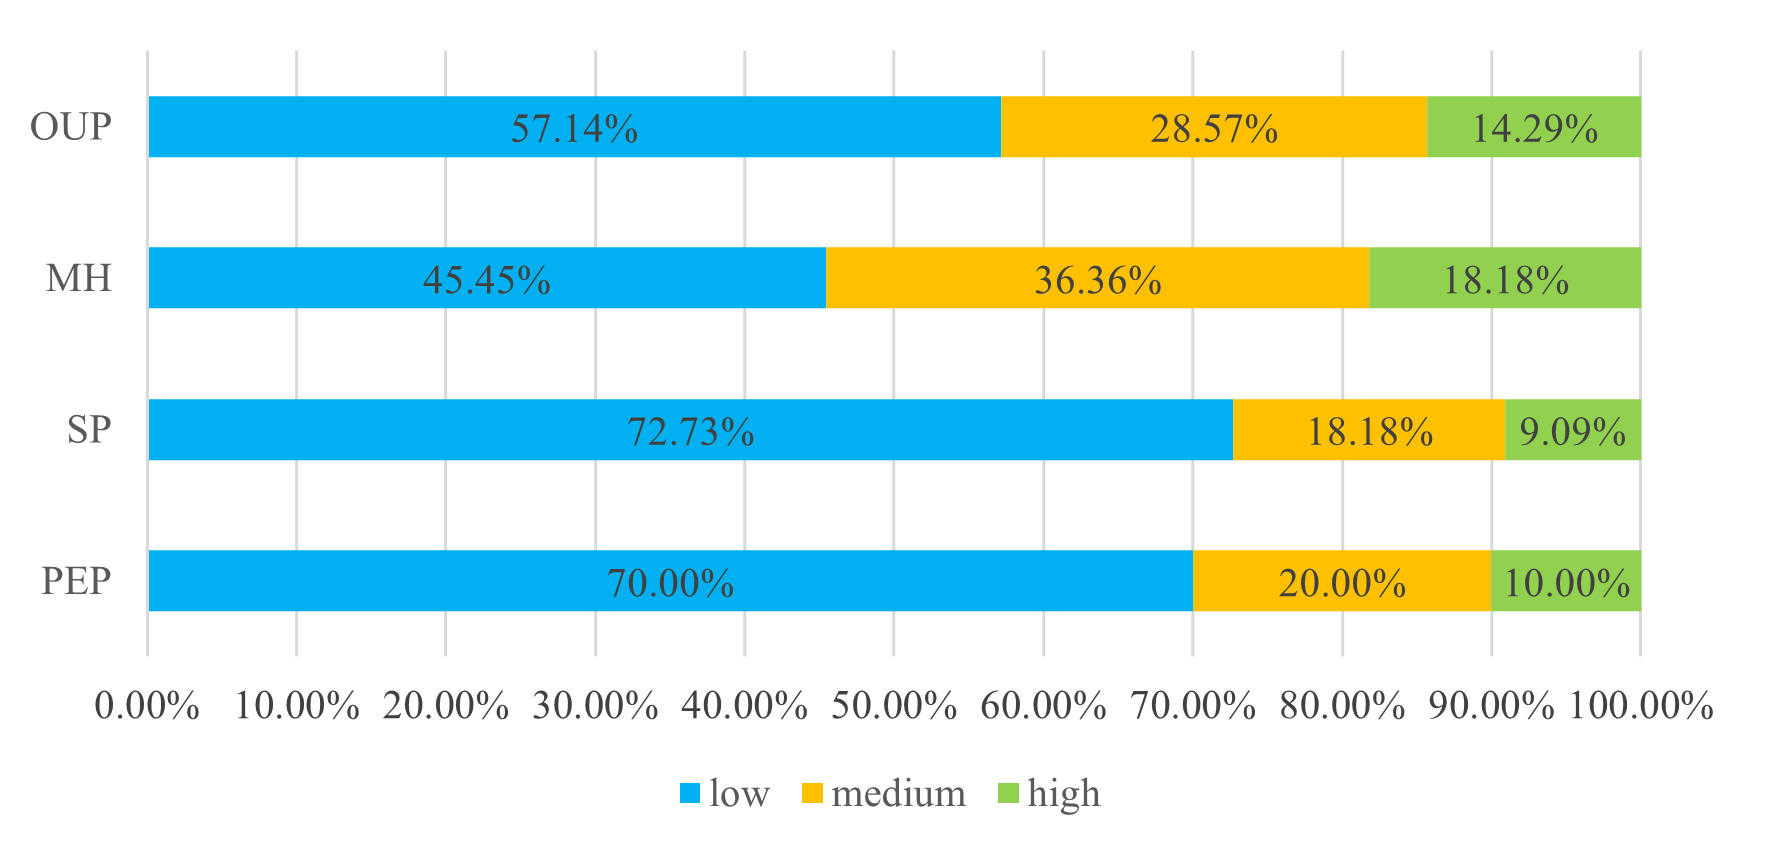
Figure 2. The systematicity of four textbooks.
4.2. Result 2: To answer the second research question
To answer the second research question, “How are graphics integrated with text in the ‘Continental Drift and Plate Tectonics’ section of the four geography textbooks?”. This study answers from the aspect of the integration of graphics with text, including five indicators (i.e., Contiguity, Indexical reference, Captions, Semantic relations, and Level of connection). The analysis results are as follows.
Table 4. Overall contiguity in four textbooks.
| Direct | Proximal | Facing | Distal | |
|---|---|---|---|---|
| PEP | 40.0% | 20.0% | 10.0% | 30.0% |
| SP | 90.9% | 0.0% | 0.0% | 9.1% |
| MH | 90.9% | 9.1% | 0.0% | 0.0% |
| OUP | 85.7% | 14.3% | 0.0% | 0.0% |
The results of the contiguity analysis are shown in Table 4. SP (90.9%) and MH (90.9%) performed the best, and the percentage of “Direct” is over 90%. The percentage of OUP “Direct” is 85.7%, and the percentage of “Proximal” is 14.3%. Neither of these textbooks shows graphics on the facing or distal side of the text. While 30% of the graphics in PEP and 9.1% of the graphics in SP were distal to the text, readers have to turn to a new page to view them, which may increase the difficulty of obtaining textual information and understanding geographical knowledge.[2]
The results of the indexical reference analysis are shown in Figure 3. The results show a high percentage of referenced graphics in PEP (90%), MH (90.91%), and OUP (85.71%), whereas the referenced graphics in SP (45.45%) were relatively less. Without indexical reference, it is difficult for students to connect graphics with text, which increases the difficulty of their learning.[37]
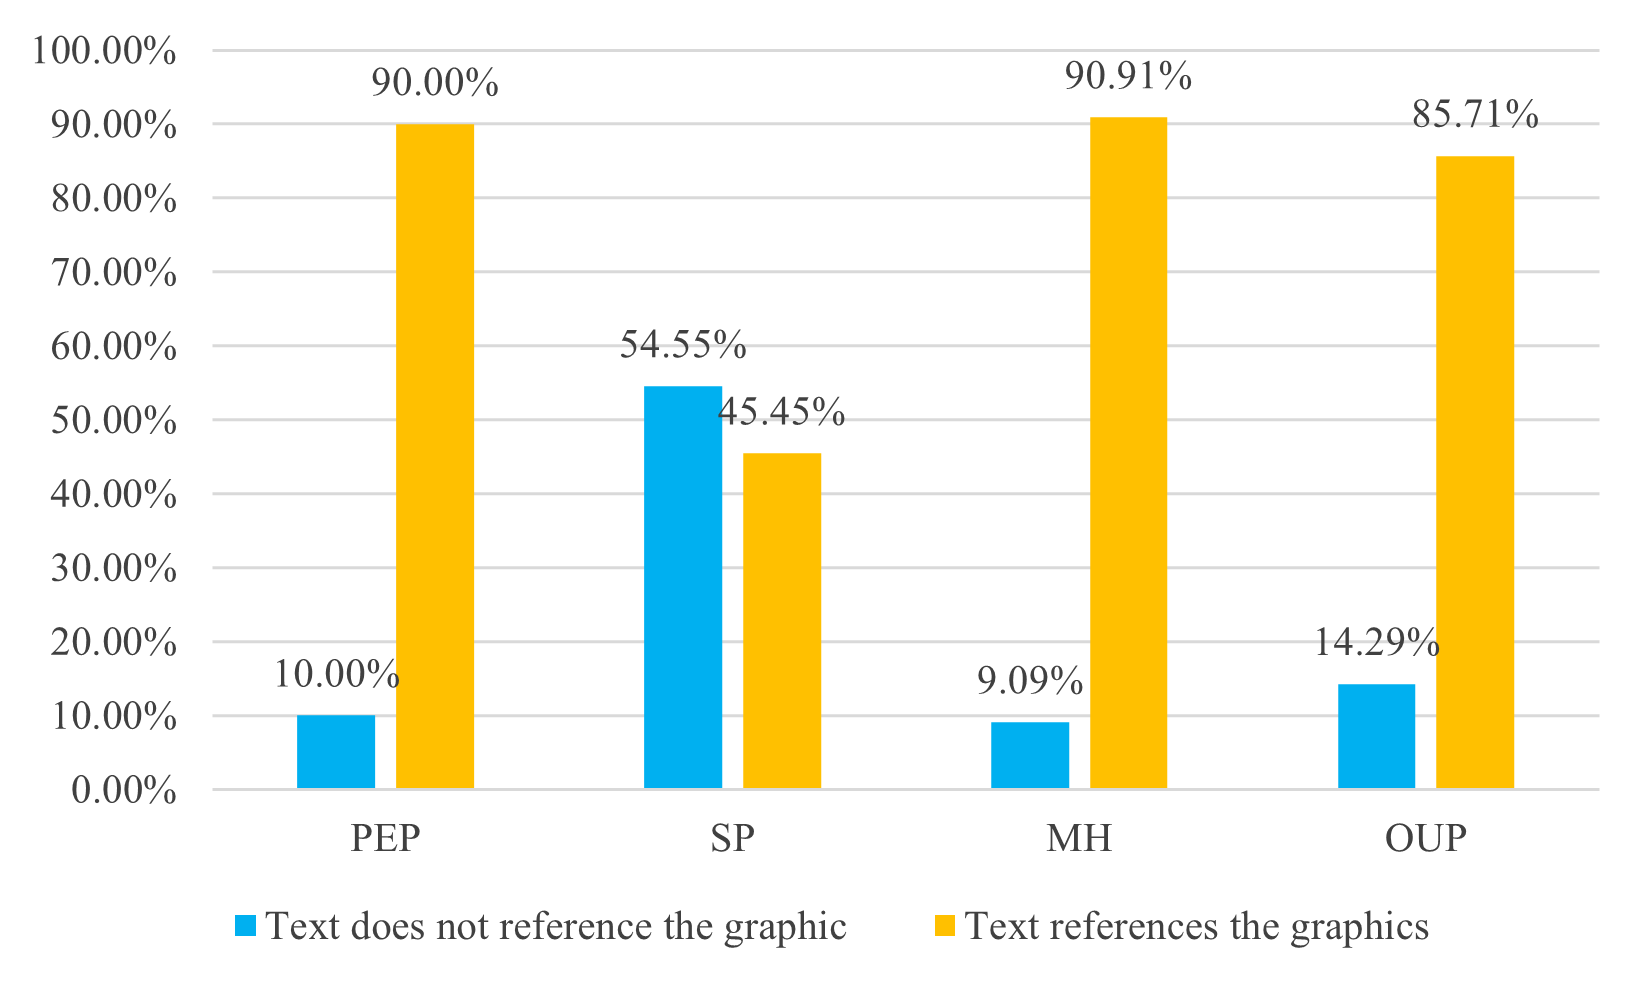
Figure 3. Indexical reference in four textbooks.
The results of the captions analysis are presented in Table 5. In PEP, 100% of captions only identified the target of the graphics but did not provide details. MH (81.8%) has the highest percentage of descriptive captions, followed by SP (45.5%). There are no “no caption” graphics in two Chinese textbooks. However, 28.6% and 9.1% of graphics in OUP and MH had “no caption”, which might create problems in understanding the graphics.[17] Furthermore, only OUP (14.3%) graphics are engaging.
Table 5. Captions in four textbooks.
| No captions | Identification | Description | Engagement | |
|---|---|---|---|---|
| PEP | 0.0% | 100.0% | 0.0% | 0.0% |
| SP | 0.0% | 54.5% | 45.5% | 0.0% |
| MH | 9.1% | 9.1% | 81.8% | 0.0% |
| OUP | 28.6% | 42.9% | 14.3% | 14.3% |
Table 6 shows the semantic relationships between graphics and related text (i.e., graphical functions) in four textbooks. None of the four textbooks has decorative graphics. Representational graphics accounted for the majority in the four textbooks (70%, 63.6%, 54.5%, and 42.9% for PEP, SP, MH, and OUP) in this study. Compared with PEP (30%), SP (36%), and OUP (42.9%), MH (45.5%) contained the most interpretational graphics. We encoded tables as organizational graphics,[38] and only OUP (14.3%) has organizational graphics. For example, “The geological timescale”.
Table 6. Overall semantic relationships in four textbooks.
| Decorative | Representational | Organizational | Interpretational | |
|---|---|---|---|---|
| PEP | 0.0% | 70.0% | 0.0% | 30.0% |
| SP | 0.0% | 63.6% | 0.0% | 36.4% |
| MH | 0.0% | 54.5% | 0.0% | 45.5% |
| OUP | 0.0% | 42.9% | 14.3% | 42.9% |
The descriptive statistics of graphic connectivity in four textbooks were presented in Table 7. There were some connection graphics in all four textbooks (10, 11, 9, and 6 in PEP, SP, MH, and OUP). Further analysis reveals that most of the connection graphics in the four textbooks are at level 1 connection (40%, 54.5%, 88.9%, and 50% for PEP, SP, MH, and OUP), allowing students to easily connect new information with text. Moreover, four textbooks have some connection graphics of Level 2 connection (40%, 36.4%, 11.1%, and 33.3% for PEP, SP, MH, and OUP), which require students to further reason. In addition, PEP (20%), SP (9.1%), and MH (16.7%) also have a small amount of Level 3 connections, requiring students to have relevant background knowledge to understand new information.
Table 7. Overall connections in four textbooks
| Counts | Level 1 | Level 2 | Level 3 | |
|---|---|---|---|---|
| PEP | 10 | 4(40%) | 4(40%) | 2(20%) |
| SP | 11 | 6(54.5%) | 4(36.4%) | 1(9.1%) |
| MH | 9 | 8(88.9%) | 1(11.1%) | 0 |
| OUP | 6 | 3(50%) | 2(33.3%) | 1(16.7%) |
5. Discussion
The purpose of this study was to examine visual representations of the “Continental Drift and Plate Tectonics” section in China, the US, and the UK junior secondary school geography textbooks in terms of graphics and the integration of graphics with text. Answer the questions “How are graphics presented in the ‘Continental Drift and Plate Tectonics’ section of the four geography textbooks?” and “How are graphics integrated with text in the ‘Continental Drift and Plate Tectonics’ section of the four geography textbooks?”.
Concerning the first research question, we discovered that four textbooks selected a higher percentage of geographical schematic maps based on the inherent qualities of the content, aligning with Zhang’s research findings.[39] For instance, the four textbooks contain “Schematic Diagram of Continental Drift” and “Schematic Diagram of Plate Tectonics”. This may be because the abstract nature of “Continental Drift and Plate Tectonics”, coupled with its extensive temporal scale and dynamic changes, may hinder students’ comprehension, as their experiences lack corresponding intuitive geographical events for supplementary understanding, while the geographical schematic map effectively illustrates the attributes of geographical phenomena and elucidates their causes, processes, and characteristics.[34] These textbooks have effectively considered the attributes of this subject, resulting in a high percentage of the geographical schematic map. However, some scholars have found that the percentage of photos and maps in geography textbooks is high, [40,41] which is speculated to be due to the different analytical samples selected by different studies. Considering the high abstraction of this part of the content, PEP and SP have chosen to use some comics because it is difficult for students to learn. In terms of systematicity, the study found that the percentage of low systematicity graphics in the four textbooks was higher, while the percentage of high systematicity graphics was lower, which is consistent with the research results of Xie and Wei.[7,42]
For the second research question, our findings indicate that the three sets of textbooks from China and the US demonstrate significant similarities in terms of contiguity and indexical reference. Graphics and associated texts are intricately connected spatially, with the text referencing graphics. Regarding captions, only OUP employs engaging captions, while the other textbooks adhere to cognitive load theory and Hegarty’s eye-tracking experiment, closely connecting the graphics with the relevant text, and have references to the graphics in the text.[2,19] Moreover, descriptive captions constitute the largest proportion of captions in MH and SP. The descriptive caption offers pupils comprehensive content information regarding the graphics, thereby facilitating a more precise understanding of the pictures’ topic.[34] For example, on page 444 in MH, “Figure 17-1 Pangaea was an angel landmass that was made up of Earth’s continents. Pangaea began to break the present apart about 200 million years ago.” And on page 24 in SP, “J, Schematic diagram of the dynamic source of continental drift, molten material erupted from the cracks in the middle of the ocean and pushed the older rock layers to both sides”. These two descriptive captions can let students know the content of the graphics.
Based on the results of this study, we would provide four recommendations for applying visual representations in geography textbooks to maximize their effectiveness in geography teaching and learning. First, it is essential to underscore the integration of graphics with text in textbook authoring by adopting a student-centered approach and enhancing our focus on their learning needs. Second, appropriately increase the percentages of highly systematic visual representations in textbooks and offer essential instruction on graphic interpretation to enhance students’ comprehension. Third, appropriately increase the percentages of descriptive and engaging captions. Last, appropriately choose a graphic form according to the particular educational content.
6. Shortcomings
The samples from four sets of Geography textbooks in China, the US, and the UK, along with the study content on “Continental Drift and Plate Tectonics”, were picked intentionally rather than randomly. The generalizability and representativeness of this research finding require additional validation in a broader sample. Furthermore, we revised the prior coding scheme to more accurately depict the visual representations in geography textbooks and assessed the reliability of the coding. Nonetheless, subjective judgment in the coding process is challenging to entirely exclude, potentially affecting the impartiality of the research findings to some degree.
Conflicts of Interest
The authors declare no conflict of interest.
Funding
2024 Qingdao Social Science Planning Project (No. QDSKL2401091).
Author contributions
Wenqing Sun: First author, Encoded, Data curation, Software, Visualization, Writing-Original Draft. Tianyi Zhang: Second author, literature search. Xue Xu: Third author and Corresponding author, Encoded, Methodology, Writing-review & editing.
References
-
B. Cavadas. “Plate tectonics in portuguese and spanish science textbooks: from the 1960S to the 1980s.” Earth Sci. Hist. 2021, 40, 2, 538–65.
-
R. E. Mayer. “The cambridge handbook of multimedia learning.” 2005.
-
M. S. Khine, Y. Liu. “Descriptive analysis of the graphic representations of science textbooks.” Eur. J. STEM Educ. 2017, 2, 3.
-
X. Yang, J. Zhang, J. Yao. “A comparative study of graphic representation in textbooks——taking the.” J. Tianjin Norm. Univ.(elem. Educ. Ed.) 2019, 20, 3, 55–59.
-
J. M. Clark, A. Paivio. “Dual coding theory and education.” Educ. Psychol. Rev. 1991, 3, 3, 149–210.
-
N. Keles, M. Nyaema. “Comparison of the different types of visual representations integrated into the contents of the United States and turkish middle school life science textbook units.” J. Vis. Lit. 2023, 42, 4, 229–45.
-
B. Wei, C. Wang, L. Tan. “Visual representation of optical content in China’s and Singapore’s junior secondary physics textbooks.” Phys. Rev. Phys. Educ. Res. 2022, 18, 2, 20138.
-
B. C. Buckley. “Interactive multimedia and model-based learning in biology.” Int. J. Sci. Educ, 2000, 22, 9, 895–935.
-
S. W. Slough, S. Kim, S. K. Jennings. “Science textbooks’ use of graphical representation: a descriptive analysis of four sixth grade science texts.” Read. Psychol. 2010, 31, 3, 301–25.
-
V. Gkitzia, K. Salta, C. Tzougraki. “Development and application of suitable criteria for the evaluation of chemical representations in school textbooks.” Chem. Educ. Res. Pract. 2011, 12, 1, 5–14.
-
P. Trahorsch, J. D. Bláha. “Visual representation of the curriculum in geography textbooks: the structure of visuals in educational medium analysis.” IARTEM E-j. 2019, 11, 2.
-
M. T. McCrudden, J. P. Magliano, G. Schraw. “The effect of diagrams on online reading processes and memory.” Discourse Process. 2011, 48, 2, 69–92.
-
R. Lemoni, A. Lefkaditou, A. G. Stamou, D. Schizas, G. P. Stamou. “Views of nature and the human-nature relations: an analysis of the visual syntax of pictures about the environment in greek primary school textbooks—diachronic considerations.” Res. Sci. Educ. 2013, 43, 1, 117–40.
-
L. Leivas Pozzer, W. Roth. “Prevalence, function, and structure of photographs in high school biology textbooks.” J. Res. Sci. Teach. 2003, 40, 10, 1089–114.
-
M. Tatalovic. “Science comics as tools for science education and communication: a brief, exploratory study.” J. Sci. Commun. 2009, 8, 4, A02.
-
J. E. Upahi, U. Ramnarain. “Representations of chemical phenomena in secondary school chemistry textbooks.” Chem. Educ. Res. Pract. 2019, 20, 1, 146–59.
-
R. E. Mayer, J. K. Gallini. “When is an illustration worth ten thousand words?” J. Educ. Psychol. 1990, 82, 4, 715.
-
E. M. McTigue, A. C. Flowers. “Science visual literacy: learners’ perceptions and knowledge of diagrams.” Read. Teach. 2011, 64, 8, 578–89.
-
M. Hegarty, P. A. Carpenter, M. A. Just. “Diagrams in the comprehension of scientific texts.” 1991, 641–68.
-
Y.-P. Ge, L. Unsworth, K.-H. Wang, H.-P. Chang. “What images reveal: a comparative study of science images between australian and taiwanese junior high school textbooks.” Res. Sci. Educ. 2018, 48, 6, 1409–31.
-
R. E. Mayer, R. Moreno. “Nine ways to reduce cognitive load in multimedia learning.” Educ. Psychol. 2003, 38, 1, 43–52.
-
E. Ozcelik, T. Karakus, E. Kursun, K. Cagiltay. “An eye-tracking study of how color coding affects multimedia learning.” Comput. Educ. 2009, 53, 2, 445–53.
-
G. Steiner-Khamsi. “Cross-national policy borrowing: understanding reception and translation.” Asia Pac. J. Educ. 2014, 34, 2, 153–67.
-
Ma W., Xia T., Sun Y. “Comparative study on visual characterization in chemistry textbook.” Educ. Chem. 43, 10, 25.
-
N. Gheyle, T. Jacobs. “Content analysis: a short overview.” Intern. Res. Note 2017, 10.
-
M. A. Naseem, G. Stöber. “Textbooks, identity politics, and lines of conflict in south Asia.” J. Educ. Media Mem. Soc. 2014, 6, 2, 1–9.
-
Pan J. “Geography (Grade 7, Vol. 1).” 2024.
-
Wang J. “Geography (Grade 8, vol. 1).” 2013.
-
McGraw-Hill. “Glencoe Earth Science.” 2020.
-
G. Rosemarie, P. Richard. “Geog.1 Student Book.” 2021.
-
K. Krippendorff. “Content analysis: an introduction to its methodology.” 2018.
-
L. Leivas Pozzer, W. Roth. “Prevalence, function, and structure of photographs in high school biology textbooks.” J. Res. Sci. Teach. 2003, 40, 10, 1089–114.
-
D. Guo, K. L. Wright, E. M. McTigue. “A content analysis of visuals in elementary school textbooks.” Elem. Sch. J. 2018, 119, 2, 244–69.
-
X. Peng. “Research on the picture system of geography textbooks of middle school - master’s thesis - dissertation.” 2004.
-
G. Qi. “Research on the Features and the Teaching Strategies of Imaging System in Geography <Compulsory Ⅰ> of Renjiaoban.” 2008.
-
A. J. Viera, J. M. Garrett. “Understanding interobserver agreement: the kappa statistic.” Fam Med 2005, 37, 5, 360–63.
-
Y.-P. Ge, L. Unsworth, K.-H. Wang, H.-P. Chang. “What images reveal: a comparative study of science images between australian and taiwanese junior high school textbooks.” Res. Sci. Educ. 2018, 48, 6, 1409–31.
-
J. R. Levin. “On empirically validating functions of pictures in prose.” Psychol. Illus. Vol. 1 1987.
-
L. Zhang. “Comparative Study of Image Systems for Geography Textbooks in Chinese and American High Schools Based on Regional Cognition.” Teach. Ref. Middle Sch. Geogr. 2018, 1, 17–20.
-
T. Janko, K. Peskova. “Analysing the types of visuals in textbooks of geography and german language: considering the instructional functioning of photographs.” Anthropologist 2013, 16, 1–2, 363–72.
-
J. D. Bláha. “Various ways of assessment of cartographic works.” 2009, 211–29.
-
S. Xie. “Research on the Quality of Illustrations in High School Biology Textbooks Based on GAP ——Take the People’s Education Edition and the Zhejiang Science Edition as Examples.” 2023.
-
K.-S. Tang. “Distribution of visual representations across scientific genres in secondary science textbooks: analysing multimodal genre pattern of verbal-visual texts.” Res. Sci. Educ. 2023, 53, 2, 357–75.